
|
Chapter One ProjectFor our chapter one project, my partner and I surveyed our entire statistics & probability class. We asked everyone what college they had planned to attend at the moment that we asked them. We found that 20% of our class was not going to college, 16% planned to attend Lansing Community College, 8% planned to attend Eastern Michigan University, and 40% of students chose colleges that did not have duplicated responses in the study.
|
|
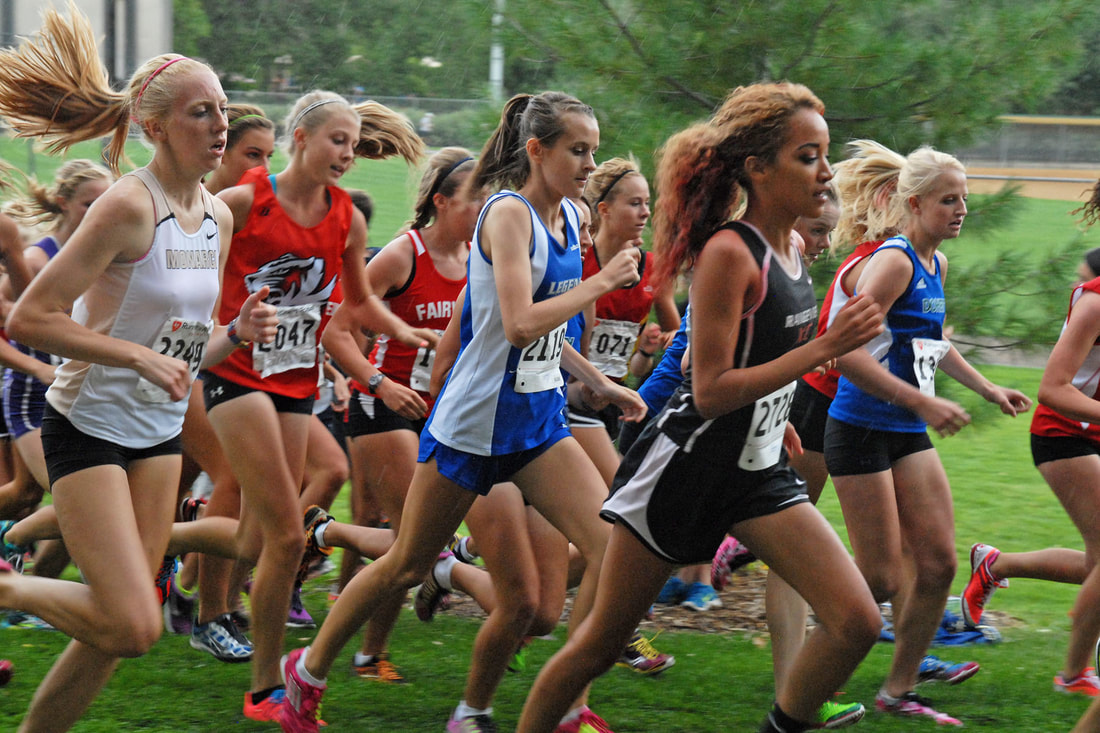
Chapter Two ProjectFor our chapter two project, my partners and I collected data from athletic.net. We chose to study the race times from the high school girls cross country CMAC jamboree 2 at Saranac high school. After creating multiple graphs to display our data, we came to a couple of conclusions. The graph that best displayed our data was the stem and leaf plot. We believe this to be true because it shows each of the time increments and how many girls ran times that fit into each time slot.
|

|
Chapter Three ProjectFor our chapter three project, my partner and I surveyed every third person starting from the top of each grade level's class list. We conducted a survey to find out how many Halloween/scary movies each student had watched during the month of October. From the data that we had collected, my partner and I were able to determine the mean, median, mode, range, standard deviation and more from our data set. We came to the conclusion that most student's watched between 0-2 scary movies during the month of October.
|

|
Chapter Four ProjectFor our chapter four project, my partner and I decided to ask student's from each grade level what their cumulative GPA was and how many hours that they spend studying in a week. The purpose of this survey was to find out if there was any correlation between how much a person studies and what their GPA is. Originally, we thought that the more that a student studies, the higher that their GPA would be. However, our study concluded that there was almost no correlation between a student's cumulative GPA and the number of hours that they spend studying in a week.
|

|
Chapter Five ProjectFor our chapter 5 project, my partner and I were assigned a topic that would demonstrate probability. Our situation was drawing two marbles out of a bag that contained seven red marbles and 13 blue marbles. We concluded that there was a 35% of drawing a red marble, a 65% chance of drawing a blue marble, a 23.9% chance of drawing a red and blue marble, and a 100% chance of drawing either a red marble or a blue marble.
|

|
Chapter Six ProjectFor our chapter 6 project, my partner and I were assigned a topic that would demonstrate binomial probabilities and probability distribution. The situation that we were given was if 15% of people can wiggle their ears, what is the probability that no one in a class of 20 statistics students can wiggle their ears? We concluded that the probability of no one in the class being able to wiggle their ears was 3.8%. We then identified that the probability of at least eight people in the class being able to wiggle their ears was .6%. From there, we talked about probabilities, the way we calculated them, and our preferred methods for making the calculations.
|

|
Chapter Seven ProjectFor the chapter 7 project, my partner and I chose to conduct a survey of students in our high school and asked them how long it took them to get ready in the morning. After we collected our data, we calculated the mean and the standard deviation. From there, we use Empirical rule to find intervals into which 68%, 95%, and 99.7% of our data would fall. We used the central limit theorem, z-scores, and empirical rule to determine different probabilities of someone with a specific answer being randomly chosen.
|
|
Chapter Eight ProjectFor our chapter 8 project, my partner and I were assigned a data set of geometry test scores and were asked to identify sample size, mean, standard deviation, degrees of freedom, critical values for different confidence levels, maximal margin of error for different confidence levels, and confidence intervals for different confidence levels. We used our set of data that we were given to conclude that the sample mean for our data set was 85.7%. We also concluded that the sample standard deviation was 11.8. Our degrees of freedom was 22. We used all of these pieces of information to calculate different intervals as well as margins of errors for different confidence levels.
|

|
Chapter Nine ProjectFor our chapter 9 project, my partner and I were given the topic of how many minutes that the average person spends on Facebook in a day. We based our topic off of an article that was written by Business Insider in 2015 titled, "Here's How Much Time People Spend on Facebook Per Day". We conducted a survey of randomly selected students in our high school and asked them how much time they spend on Facebook in a day. The article told us that the average time spent is 20 minutes. We decided that our null hypothesis was Ho: 20 minutes. Our alternate hypothesis was H1: <20 minutes. Our sample mean for our set of data was 20 minutes. This resulted in our T value that we collected to be 0. From there, we concluded that our p-value was so high above our level of significance that there was no way for us to reject our null hypothesis.
|
